How to understand the graph

Post Reply
User avatar
James
Site Admin
Posts: 1080
Joined: Wed Jan 02, 2013 9:06 pm

Re: How to understand the graph

Post by James »

This data is not very good. Lots of interference.
On the RAW view, you can see the data bouncing from ~700uV to ~900uV, that's 200uV of movement! You want it to be MUCH MUCH less. This is probably why your Delta is so high in that recording.

In your live screenshot above, it looks like you have already got a better signal, so just aim for this each time :-)
Before you start recording, always go to the RAW EEG view and get a nice picture like above; only then start recording :-)
josehernandez
Posts: 2
Joined: Sun Apr 12, 2020 7:12 pm

Re: How to understand the graph

Post by josehernandez »

Hi everyone!! I have another question.... using my muse band I can see that when I do ChiKung (it involves body movement); Delta wave go hi up... Are the measeure of Delta affected by forehead movement... Because I'm sure that i'm no monk to raise my Delta waves to that peak jejejejej. Delta waves are hi in profound sleep correct? Saludos!! Thanks for any help I can get!!
minnatrix
Posts: 1
Joined: Sun Jun 28, 2020 8:33 pm

Re: How to understand the graph

Post by minnatrix »

Hey,
Can anyone explain why I have elevated brainwaves in the 64hz region?
Attachments
Screenshot_20200628-173623_compress87.jpg
Screenshot_20200628-173623_compress87.jpg (88.18 KiB) Viewed 3052 times
User avatar
James
Site Admin
Posts: 1080
Joined: Wed Jan 02, 2013 9:06 pm

Re: How to understand the graph

Post by James »

It's probably 60hz from your electricity. Move near/away from a floor lamp to test
richenergy718
Posts: 3
Joined: Sat Jul 11, 2020 10:52 pm

Re: How to understand the graph

Post by richenergy718 »

James wrote: Sun Apr 12, 2020 3:16 pm You should only have ~50uV of up/down movement on the RAW EEG for good signal quality. Ideally much less.
Ignoring the Delta, your highest consistent wave is Alpha.


The lowest number I see delta waves are on this graph is about 35. The highest number is about 75. The difference between those two figures are 40. The average says 45.203 and the relative is 0.167.

I'm unsure of the logic for determining the appropriate figures for good signal. How come ~50uv of up/ down movement is what we should shoot for?

How would ~50 up/down movement look like on a graph? What other graph in this thread shows us this number? Where else could we go to check for this figure?
User avatar
James
Site Admin
Posts: 1080
Joined: Wed Jan 02, 2013 9:06 pm

Re: How to understand the graph

Post by James »

+-50uV for RAW EEG, not brainwaves.
richenergy718
Posts: 3
Joined: Sat Jul 11, 2020 10:52 pm

Re: How to understand the graph

Post by richenergy718 »

minnatrix wrote: Sun Jun 28, 2020 8:37 pm Hey,
Can anyone explain why I have elevated brainwaves in the 64hz region?
2 questions about this photo.

A) What is this graph called?
B) How to interpret data on this graph?
User avatar
James
Site Admin
Posts: 1080
Joined: Wed Jan 02, 2013 9:06 pm

Re: How to understand the graph

Post by James »

richenergy718 wrote: Sun Jul 12, 2020 11:56 am A) What is this graph called?
B) How to interpret data on this graph?
This is the Discrete frequency graph. You can see the power spectral densities for individual frequencies.
This lets you see the constituent parts of the five brainwaves. For example, the green area is Beta(β), and shows individual frequencies from 13Hz to 30Hz.
richenergy718
Posts: 3
Joined: Sat Jul 11, 2020 10:52 pm

Re: How to understand the graph

Post by richenergy718 »

Looking at the horseshoe image located on the bottom left corner, I must ask what's the difference between the empty circles and the ones that are filled in?

Thanks
ALPHABRAIN8675
Posts: 19
Joined: Mon Jul 13, 2020 6:34 am

Re: How to understand the graph

Post by ALPHABRAIN8675 »

Graph#0-BEST ALPHA GRAPH.PNG
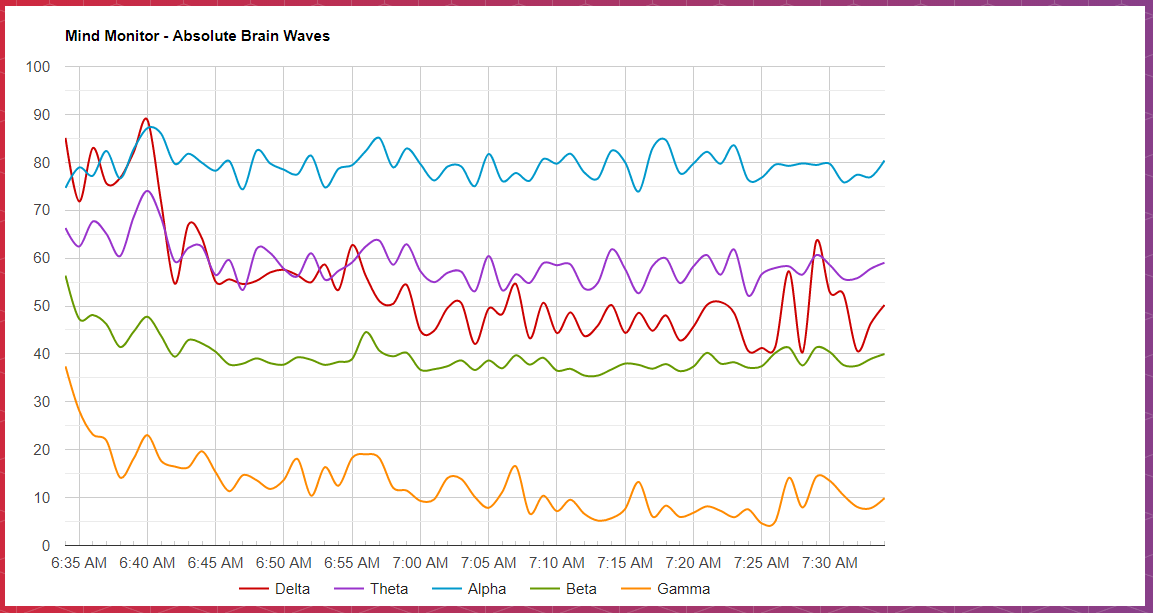
Graph#0-BEST ALPHA GRAPH.PNG (83.67 KiB) Viewed 2834 times
James
Pleasure to meet w you in the virtual world. Thank you for the forum and I do like your Avatar here :)
A wonderful app in the mind monitor (I was so searching for this as the muse graph of active- neutral- calm; was good but not good enough). I needed to see the brainwaves and so thank you for this app; it has cut down the lead cycle for insights by 10 years if not sure :)

Attached is a MM graph which carbophoze shared( thanks mate) and is helpful to understand what does GOOD mean; so my qn for you is
- On the Y axis what value can alpha attain ; what is the upper limit; if there is any?
- It starts at 80 and is parallel to x axis ; can alpha have an upward trend that starts 80PSD and goes upto say 200 PSD in relation to the calmness of thought OR will it start at 200 PSD if more calm and remain parallel?
Post Reply